Neural Networks
Multi-layer Neural networks
R Packages
Data in Python
Multilayer Neural Networks
Multilayer Neural Networks
Other Topics
Multi-Layer Neural Network in R
Training/Validating/Testing Data
Neural Network
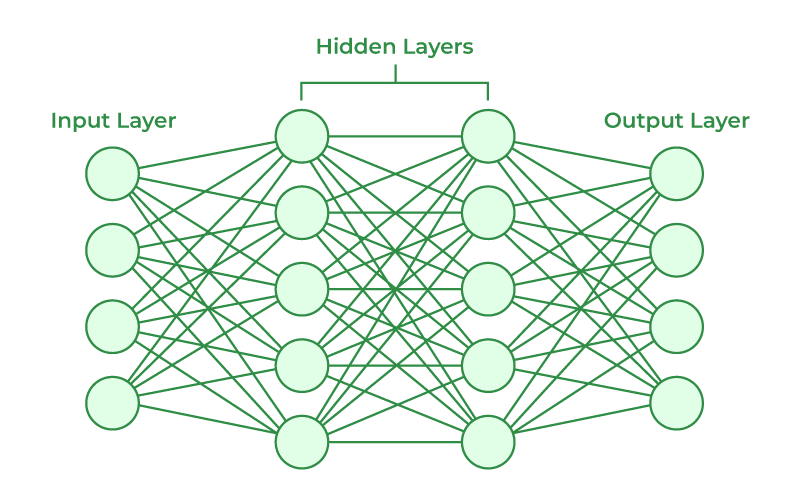
Neural Network Composition
- Inputs: A set of characteristics in the data that we use to predict the outcome of interest
- Outputs: A set of variables (may be one) we wish to predict
- Hidden Layers: A set of functions that will transform the data such that it can better predict the outputs
- Each hidden layer will has nodes that indicates the transformation
Multilayer Neural Network
Multilayer Neural Networks create multiple hidden layers where each layer feeds into each other which will create a final outcome.
Model Setup
\[ Y = f(\boldsymbol X; \boldsymbol \theta) \]
- \(\boldsymbol X\): a vector of predictor variables
- \(\boldsymbol \theta\): a vector of parameters ( \(\boldsymbol \alpha, \boldsymbol \beta, \boldsymbol \gamma, \boldsymbol \delta\))
Multilayer Neural Network
Hidden Layer 1
With \(p\) predictors of \(X\):
\[ h^{(1)}_k(X) = H^{(1)}_k = g\left\{\alpha_{k0} + \sum^p_{j=1}\alpha_{kj}X_{j}\right\} \] for \(k = 1, \cdots, K\) nodes.
Hidden Layer 2
\[ h^{(2)}_l(X) = H^{(2)}_l = g\left\{\beta_{l0} + \sum^K_{k=1}\beta_{lk}H^{(1)}_{k}\right\} \] for \(l = 1, \cdots, L\) nodes.
Hidden Layer 3 +
\[ h^{(3)}_m(X) = H^{(3)}_l = g\left\{\gamma_{m0} + \sum^L_{l=1}\gamma_{ml}H^{(2)}_{l}\right\} \] for \(m = 1, \cdots, M\) nodes.
Output Layer
\[ f(X) = \beta_{0} + \sum^M_{m=1}\beta_{m}H^{(3)}_m \]
Fitting a Neural Network
Fitting a neural network is the process of taking input data (\(X\)), finding the numerical values for the paramters that will minimize the following loss function, mean squared errors (MSE):
\[ \frac{1}{n}\sum^n_{i-1}\left\{Y_i-f(\boldsymbol X; \boldsymbol \theta)\right\}^2 \]
Other Topics
Multilayer Neural Networks
Other Topics
Multi-Layer Neural Network in R
Training/Validating/Testing Data
Nonlinear (Activations) Function \(g(\cdot)\)
Activation functions are used to create a nonlinear affect within the neural network. Common activation functions are
Sigmoidal: \(g(z) = \frac{1}{1+e^{-z}}\) (nn_sigmoidal)
ReLU (rectified linear unit): \(g(z) = (z)_+ = zI(z\geq0)\) (nn_relu)
Hyperbolic Tangent: \(g(z) = \frac{\sinh(z)}{\cosh(z)} = \frac{\exp(z) - \exp(-z)} {\exp(z) + \exp(-z)}\) (nn_tanh)
Otherwise, the neural network is just an overparameterized linear model.
Optimizer
The optimizer is the mathematical algorithm used to find the numerical values for the parameters \(\beta_j\) and \(\alpha_{kl}\).
The most basic algorithm used in gradient descent.
Multi-Layer Neural Network in R
Multilayer Neural Networks
Other Topics
Multi-Layer Neural Network in R
Training/Validating/Testing Data
Penguin Data
Build a multi-layer neural network that will predict body_mass with the remaining predictors.
Model Setup
modelnn <- nn_module(
  initialize = function(input_size) {
    self$hidden1 <- nn_linear(in_features = input_size,
                              out_features = 20)
    self$hidden2 <- nn_linear(in_features = 20,
                              out_features = 10)
    self$hidden3 <- nn_linear(in_features = 10,
                              out_features = 5)

    self$output <- nn_linear(in_features = 5,
                             out_features = 1)

    self$activation <- nn_relu()
  },
  forward = function(x) {
    x |>
      self$hidden1() |>
      self$activation() |>

      self$hidden2() |>
      self$activation() |>

      self$hidden3() |>
      self$activation() |>

      self$output()
  }
)
Setup
Model Fitting
Training/Validating/Testing Data
Multilayer Neural Networks
Other Topics
Multi-Layer Neural Network in R
Training/Validating/Testing Data
Error Rate
When creating a model, we are interested in determining how effective the model will be in predicting a new data point, ie not in our training data.
The error rate is a metric to determine how often will future data points be wrong when using our model.
The problem is how can we get future data to validate our model?
Training/Validating/Testing Data
The Training/Validating/Testing Data set is a way to take the original data set and split into 3 seperate data sets: training, validating, and testing.
This is data used to create the model.
This is data used to evaluate the data during it’s creation. It evaluates at each iteration (Epoch)
This is data used to test the final model and compute the error rate.
Training/Validating/Testing Proportions
\[ 80/10/10 \]
\[ 70/15/15 \]
Training Error Rate
Training Error Rate is the error rate of the data used to create the model of interest. It describes how well the model predicts the data used to construct it.
Test Error Rate
Test Error Rate is the error rate of predicting a new data point using the current established model.
Penguin Data
Model Description
modelnn <- nn_module(
  initialize = function(input_size) {
    self$hidden1 <- nn_linear(in_features = input_size,
                              out_features = 20)
    self$hidden2 <- nn_linear(in_features = 20,
                              out_features = 10)
    self$hidden3 <- nn_linear(in_features = 10,
                              out_features = 5)

    self$output <- nn_linear(in_features = 5,
                             out_features = 1)

    self$activation <- nn_relu()
  },
  forward = function(x) {
    x |>
      self$hidden1() |>
      self$activation() |>

      self$hidden2() |>
      self$activation() |>

      self$hidden3() |>
      self$activation() |>

      self$output()
  }
)
Optimizer Set Up
Fit a Model
Testing Model
m408.inqs.info/lectures/3a